Recently, my truck turned on the check engine light and there were some codes: P0108 Map Sensor High, P)128 ECT Low and P2563Turbo Pos SensorCircuit A High., all the involved sensors use the 5V Ref from the ECM. The truck ran just fine as far as I could tell. Never had codes like that in the past. I used my BlueDriver to look at the input for several 5V sensors that show live data in the tool. There isn't a complete match to the DTCs. What I saw was a rapidly varrying system voltage from about 12V to about 25V. I sent Blue Driver a message and asked them about this. Blue Driver was nice enough to look into my problem and sent me a new tool. Very nice of them. So I decided to do some data logging of some of the sensors to see what the values were.
ECT Engine Coolant Temperature, IAT Ambient Air Temperature, - those values should change over time as the engine and air temp rise but not fluctuate or go negative, but they did. They dropped down low and spiked.
BARO - should be very consistent, but drops and spikes there.
MAP and MAF - while these will vary with driving conditions, engine load, etc, again drops and spikes.
Control Module Voltage - Appears to be system voltage or battery voltage. This might go up and down depending on the conditions. Like the others, dropouts, and spikes. Battery voltage at almost 25V?? Where does that come from?
I went thru the datalog identifying and highlighting the erratic values of the various devices expecting to see a relationship between voltage and other aberrations but it only happened in a few instances. I spent a couple of hours preparing the spreadsheet and saved my work multiple times, but the program crashed, and my saves were not actually saved. Otherwise, I would attach the highlighted sheet with the problematic values for you to see. I did attach the raw sheet. It's a lot to look through but easy enough to spot the problem data points.
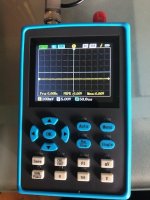
I note that MAP, BARO, ECT, and IAT are all 5V ref powered devices. I don't have a way to monitor these because it happens so quickly, way too fast for a DVM to capture and display. Now is when I wished I had a nice scope with graphing capabilities.
Any idea what could be happening to cause this? What to test to identify the problem(s) to be solved?


